Two projects, measured in hard numbers.
Consistent color across three plants
Problems caused by colorShare of all customer claims and production scrap
BeforeAfter 2 years
Show data
| Customer claims | Before | 83% |
| Customer claims | After 2 years | 21% |
| Production scrap | Before | 64% |
| Production scrap | After 2 years | 15% |
All customer claimsIndex, start of project = 100
Show data
| Start | Start of project | 100 |
| After 2 years | 27 |
Problem
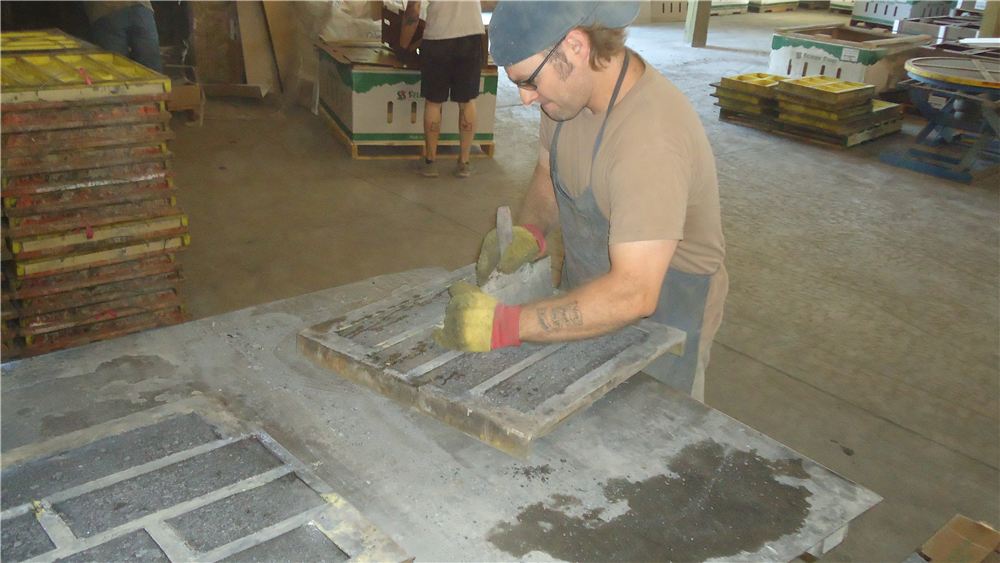
Most claims and scrap came from color variation across 120 colors and three plants, each with its own method.
Approach
A colorimeter on the floor, color standards with control limits, procedures, and operator certification at every plant.
Result
Claims down 73% overall and $2.4 million saved in two years. Five employees promoted to supervisor.
Faster builds with quick changeovers
Hours of work per street cornerBefore mapping, the new plan, and the actual average
Show data
| Original plan | 36 h | |
| Mapped plan | 21 h | |
| Actual average | 19 h |
Problem
36 hours per corner, three crews sharing machines and tools, working around traffic.
Approach
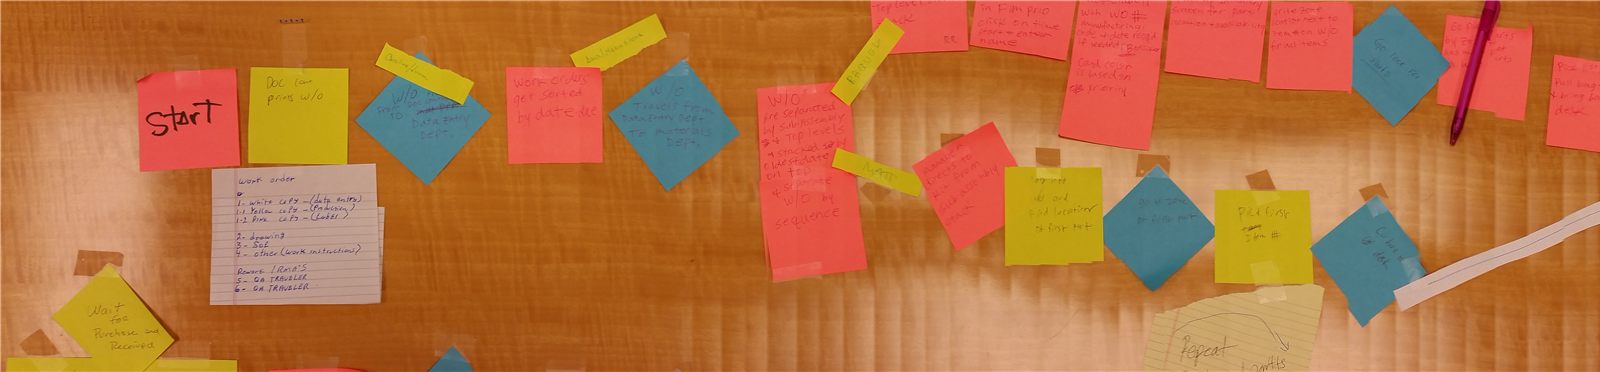
Process map with the crews: preparation ahead of time, parallel tasks, shared resources at peaks.
Result
19 hours on average, operating cost down 29%, and a return of 7 times the investment in 8 months.